This article stems from an observation of mine: in my courses, every time I demonstrate the procedure for creating a profile and, at the end, apply it to a Color Checker image showing the before and after, I often notice amazed and enthusiastic expressions at the color change.
But every time I ask myself: "It's definitely a surprise due to the before-and-after effect. But will it really be a better profile?"
So, what does it mean to do this? Or rather: how can we check whether or not we have improved the 'fidelity' of the color rendering of our sensor?
Let's assume that the camera profile provided by Adobe (Adobe Standard) is the most colorimetrically correct; if nothing else, it's a starting point. Now we should check whether the custom profile we created is better in terms of fidelity, that is, whether it renders the photographed colors more accurately. Strictly speaking, we should photograph known colors, materials whose Lab values are known (or can be measured). Once this is done, we should develop the raw file with the Adobe Standard profile and save a copy of it; then we should repeat the same operation but with the custom profile and compare the two files. I cannot stress enough that when talking about color 'fidelity' you need two measurements and the 'quality' or 'fidelity', if you will, of a camera profile is based on a comparison between these two measures!
The result of the color difference calculation is expressed in deltaE (the unit of measurement for color difference in Lab space) where the unit (1 deltaE) represents the smallest difference, if not imperceptible to the human eye, between two color samples; the higher the value, the greater the color difference. The deltaE value can be calculated in various ways; in this case, I'll use the deltaE 2000 formula proposed by the CIE.
But which colors can we choose as known colors for comparison? In this case, we'll use the X-Rite Colorcheker target, whose 24 colors are both known (downloadable from the X-Rite website) and measurable. I measured my personal target, obtaining a list of 24 Lab colors that we'll use as a comparison to measure the 'fidelity' of the created profile compared to the profile provided by Lightroom or Camera Raw called Adobe Standard. As already mentioned, this profile, if not manipulated by the user, is the basic color rendition of our images. Fig. 1 shows the list of Lab colors in my target; these are the true Lab colors against which we'll measure the fidelity of our profile: the closer we are to these values, the more 'faithful' our profile can be defined.

Fig. 1
We photograph the ColorChecker whose colors we measured (I did this using an i1 Pro 2 spectrophotometer), or we use the generic data provided by X-Rite, and, after creating a custom camera profile, we open the ColorChecker raw file first with the Adobe Standard profile and then with the custom profile. In both cases, we save a TIFF file for comparison. See fig. 2
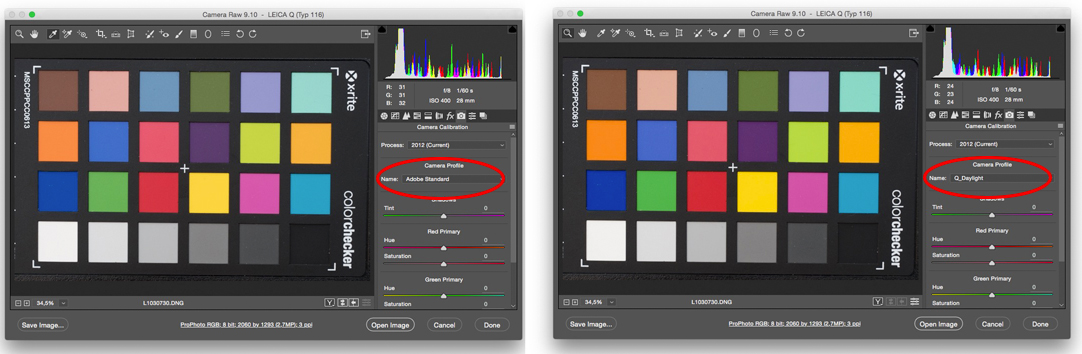
Fig. 2
Now we need to compare the 24 colors in the file, which we'll call Standard, with the target's Lab color list. We'll then compare the developed image with the custom profile, which we'll call Custom, to determine which of the two profiles more faithfully reproduces my target's colors. In this article, we'll skip the process of creating the .dcp profile (explained in previous articles) and move straight to the step of extracting the 24 target colors from the respective images.
Since there are few colors, you could also calculate them directly in Camera Raw but, for this time, I will use a software called ColorThink Pro by Chromix which has a function that allows you to quickly extract a list of Lab colors from the tiff file.
We open the first image with this software and choose the specific tool for calculating the 24 ColorChecker colors. Once the operation is performed, the software extracts the RGB values and Lab values of the target. In this case, the RGB values, with which I saved the TIFFs, refer to ProPhoto, a space I decided to use to avoid any possibility of clipping in the photographed colors. In any case, we are interested in the Lab values to calculate the deltaE, so we will save a list of the 24 colors rendered by the standard profile as a text file. See fig. 3

Fig. 3
At this point, we repeat the operation for the image rendered with the colors of the personal profile and move on to the comparison. Using the same software, we now open the list of 24 real colors, measured directly on the target, and keep it for comparison. We then open the list of colors rendered with the standard profile and analyze the differences in deltaE. See fig. 5

Fig. 5
We can see that, with the standard profile, we have excellent fidelity in two colors (green squares, meaning less than 2 deltaE) which, however, correspond to two grays, while in other bars we have differences highlighted in yellow (between 2 and 4 deltaE) and orange (between 4 and 10 deltaE). We now ask the software to create a report from this comparison and save it to compare it with the next test on the personal profile. See fig. 6

Fig. 6
We repeat the operation with the personal profile, comparing the list of real colors with the list obtained from the previously created TIFF file. We use the software to recall the same delta E calculation performed previously and look at the result shown in Fig. 7, then create the ratio in the same way.

Fig. 7
We can immediately notice how some colors are highlighted in green (6 instead of the 2 in the previous example), which means a smaller error. Now let's move on to the statistical analysis of the two ratios, knowing that the lower the deltaE resulting from applying the profile, the better the profile's fidelity. In other words, the camera profile with the lowest deltaE will certainly be the one most faithful to the original colors. In Fig. 8, we see the calculations performed by the software: on the left, the performance of the standard profile and, on the right, that of the custom profile.

Fig. 8
In this case, we're talking about a Leica Q under daylight. We can say that the custom profile is slightly more faithful, but the difference is truly minimal: it goes from an average deltaE of 4.07 (standard profile) to 4.04 (custom profile); the average deltaE for the best colors also drops from 3.52 (standard profile) to 3.43 (custom profile). However, we note that the deltaE for the worst 10% colors increases in the custom profile, going from 7.92 to 8.30.
In conclusion, although I can assure you that a visual difference between the two images is evident—I'm referring to the before and after—the mathematical calculation gives us a different result, practically irrelevant in terms of fidelity. It can happen. With this technique or procedure, however, we can continue to measure other differences between different camera profiles, or those made with different software, or in critical lighting conditions.